1. Examinations and Sample Solutions
PDF naming convention:PDF-1 refers to the first and PDF-2 to the second PDF document for two examination events of a semester. Students in the assessment semester are eligible candidates for a second examination event, i.e. PDF-2. PDF-A and PDF-B refer to parameter variations in an examination. PDF-1A and PDF-1B refer to a first examination event with a parameter variation A or B.
Examination grading convention:
Examinations are either ungraded (i.e. rated 'passed' or 'not passed') or graded 1 (very good) to 5 (bad).
Graded examinations are passed with grades 4 or lower.
1.1 Examinations and Sample Solutions - Digital Engineering (since 2020)
| Term | Examination | Sample Solution | SWS/ECTS | Branches of Study/Attendees | Evaluation | Environment Protection |
|---|---|---|---|---|---|---|
| Summer'25 | [PDF] | [PDF] | 4/5 | 2/38 | [w3] | [w3] |
| Winter'24 | [PDF-1],[PDF-2A],[PDF-2B] | [PDF-1],[PDF-2A],[PDF-2B] | 4/5 | 3(+1)/44 | [w3] | [w3] |
| Summer'24 | [PDF-1],[PDF-2] | [PDF-1],[PDF-2] | 4/5 | 2/14 | [w3] | [w3] |
| Winter'23 | [PDF-1],[PDF-2] | [PDF-1],[PDF-2] | 4/5 | 3(+1)/70 | [w3] | [w3] |
| Summer'23 | [PDF-1],[PDF-2] | [PDF-1],[PDF-2] | 4/5 | 4/92 | [w3] | [w3] |
| Winter'22 | [PDF-1],[PDF-2] | [PDF-1],[PDF-2] | 4/5 | 1/39 | [w3] | [w3] |
| Summer'22 | [PDF] | [PDF] | 4/5 | 2/37 | [w3] | [w3] |
| Winter'21 | [PDF-DE] [PDF-EN] | |||||
| Summer'21 | [PDF] | [PDF] | 4/5 | 2/49 | N/A | |
| Winter'20 | [PDF-1],[PDF-2] | [PDF-1],[PDF-2] | 4/5 | 1(+1)/60 | N/A | |
| Summer'20 | [PDF-1],[PDF-2] | [PDF-1],[PDF-2] | 4/5 | 2/51 | N/A | |
1.2 Examinations and Sample Solutions - Electrical Engineering (since 2020)
| Term | Examination | Sample Solution | SWS/ECTS | Branches of Study/Attendees | Evaluation | Environment Protection |
|---|---|---|---|---|---|---|
| Summer'25 | [PDF] | [PDF] | 4/5 | 2/45 | [w3] | [w3] |
| Winter'24 | [PDF] | [PDF] | 4/5 | 2/44 | [w3] | [w3] |
| Summer'24 | [PDF] | [PDF] | 4/5 | 3/24 | [w3] | [w3] |
| Winter'23 | [PDF] | [PDF] | 4/5 | 2/42 | [w3] | [w3] |
| Summer'23 | [PDF-A],[PDF-B] | [PDF-A],[PDF-B] | 4/5 | 1/17 | [w3] | [w3] |
| Winter'22 | [PDF] | [PDF] | 4/5 | 2/50 | [w3] | [w3] |
| Summer'22 | [PDF-1],[PDF-2] | [PDF-1],[PDF-2] | 4/5 | 1/17 | [w3] | [w3] |
| Winter'21 | [PDF-DE] [PDF-EN] | |||||
| Summer'21 | [PDF-1],[PDF-2] | [PDF-1],[PDF-2] | 4/5 | 1/6 | N/A | |
| Winter'20 | [PDF-1],[PDF-2] | [PDF-1],[PDF-2] | 4/5 | 1/13 | N/A | |
| Summer'20 | [PDF-1],[PDF-2] | [PDF-1],[PDF-2] | 4/5 | 1/15 | N/A | |
2. Course Evaluation
Course evaluations and examination statistics for my courses 'Digital Engineering' and 'Electrical Engineering'.
2.1 Key Performance Indicators - Digital Engineering
| Examination performance over semester |
|---|
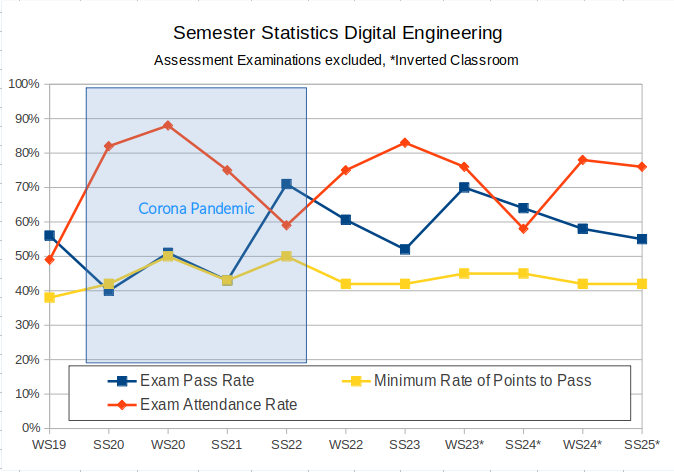 |
2.2 Examination Pass Rates - Digital Engineering (2015 - today)
| Semester | Participants | Passed | Percentage |
|---|---|---|---|
| SS2025[3] | 29 | 16 | 55% |
| WS2024[3] | 43 | 25 | 58% |
| SS2024[3] | 14 | 9 | 64% |
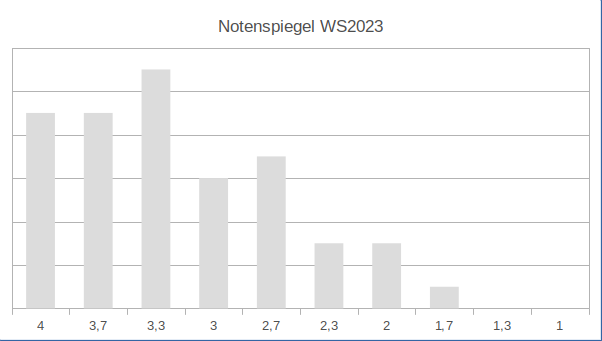
| WS2023[3] | 70 | 49 | 70% |
| SS2023 | 60 | 30 | 50% |
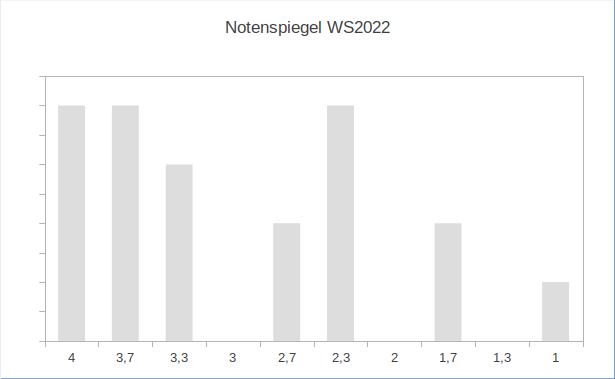
| WS2022 | 33 | 20 | 61% |
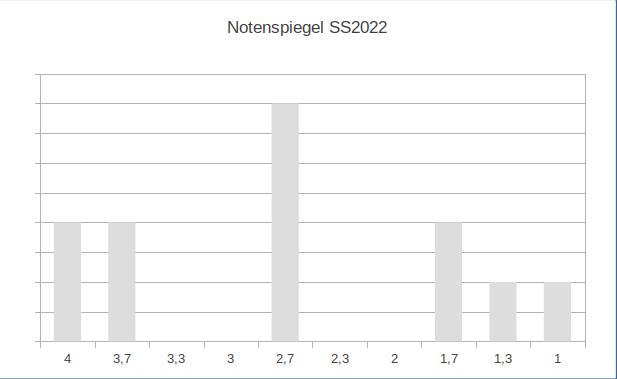
| SS2022 | 17 | 12 | 71% |
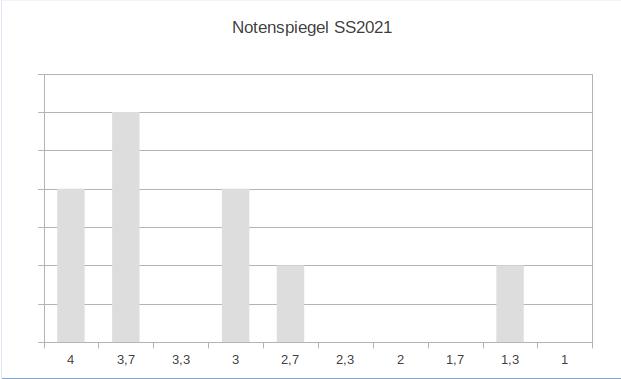
| SS2021 | 21 | 9 | 43% |
| WS2020[2] | 56 | 33 | 59% |
| SS2020[2] | 50 | 20 | 40% |
| WS2019 | 65 | 35 | 55% |
| SS2019 | 48 | 26 | 55% |
| WS2018 | 75 | 46 | 61% |
| SS2018 | 93 | 68 | 73% |
| WS2017 | 105 | 54 | 51% |
| SS2017 | 106 | 53 | 50% |
| WS2016 | 94 | 60 | 64% |
| SS2016 | 115 | 89 | 77% |
| WS2015 | 110 | 65 | 59% |
| SS2015 | 75 | 47 | 62% |
| Total | 1277 | 766 | 60% |
[2] free trial of examination due to Corona pandemic (uncounted if failed as per decision of the university steering committee)
[3] Inverted Classroom Teaching Method
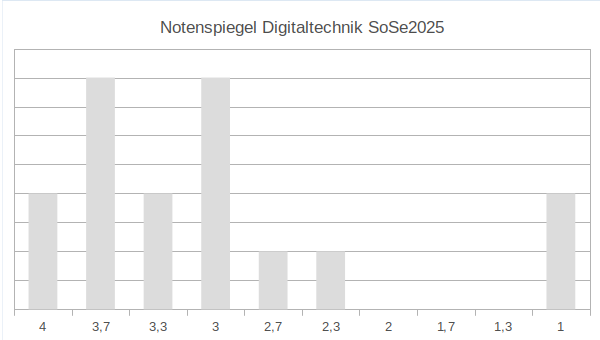
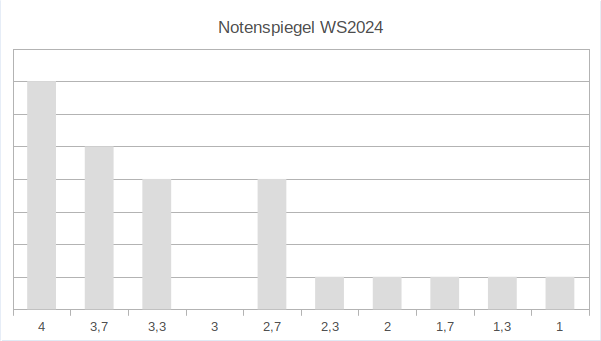
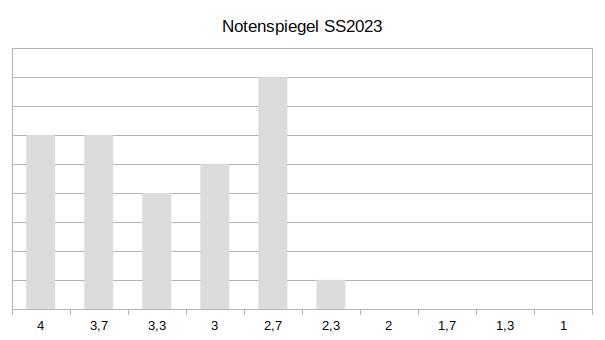
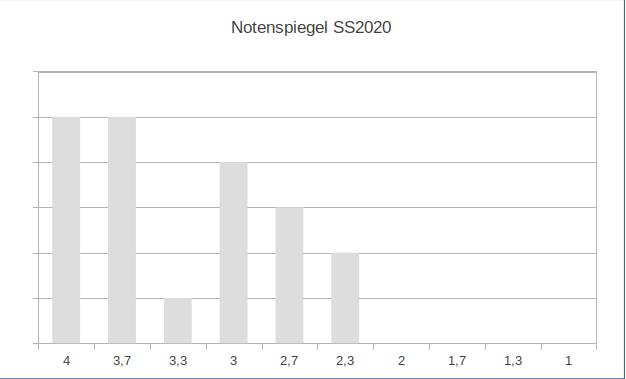
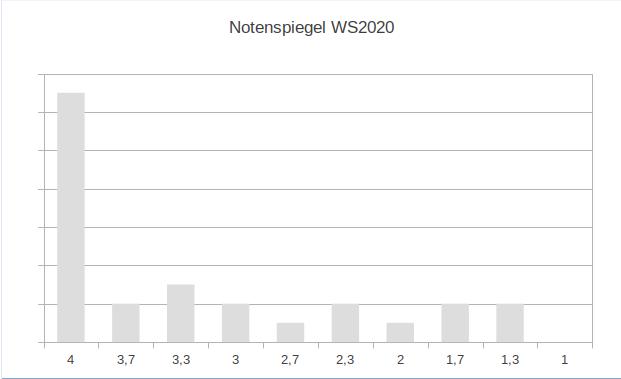
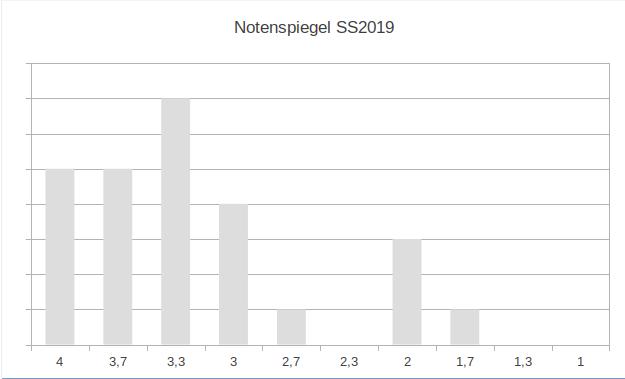
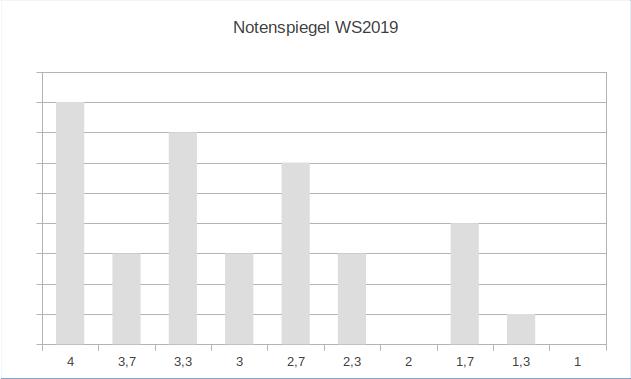
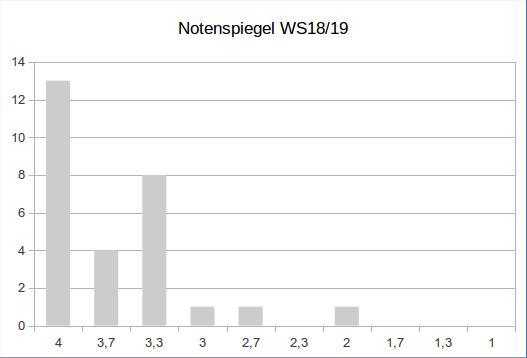
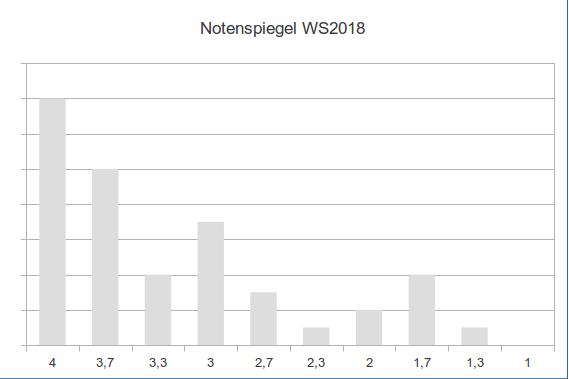
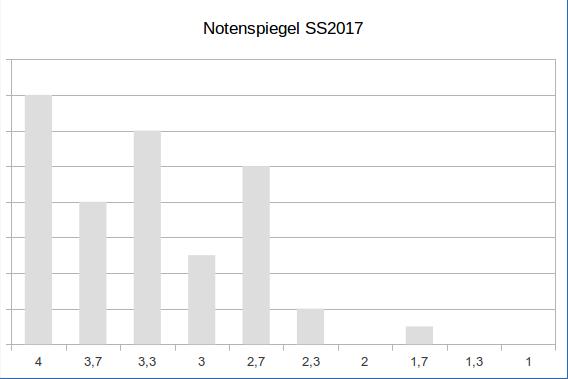
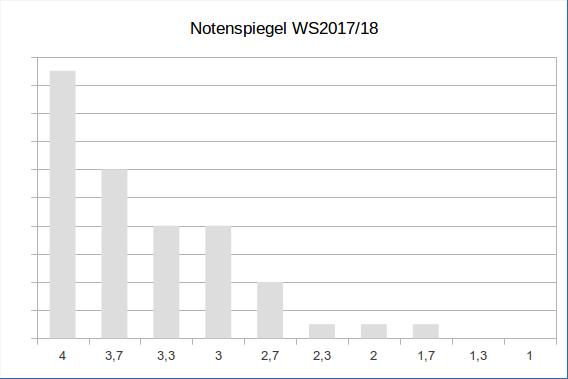
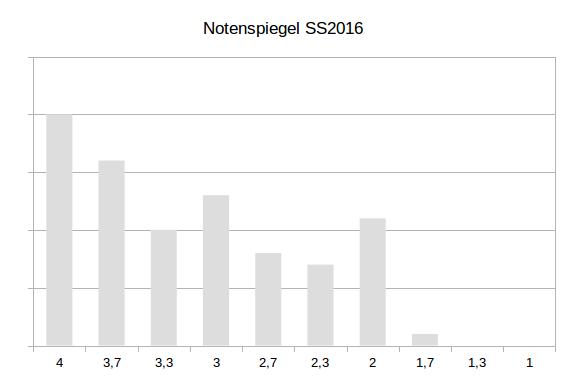
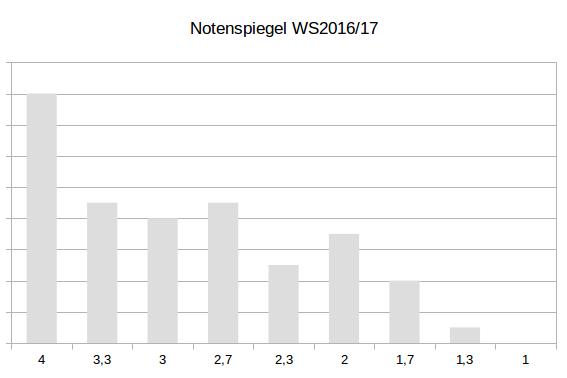
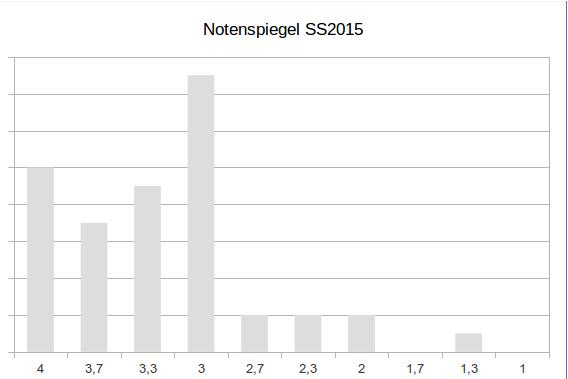
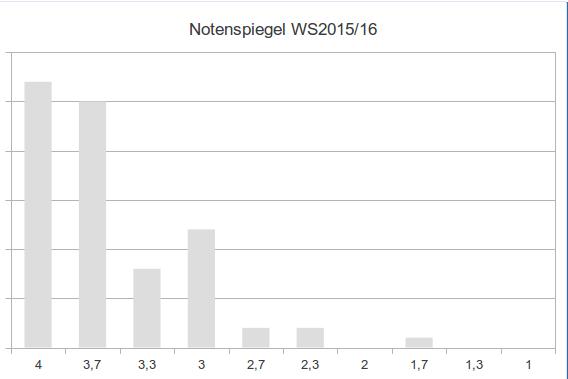
2.3 Grades Overview - Digital Engineering (2015 - today)
Examination are ungraded (i.e. rated 'passed' or 'not passed') or are graded between 1 (very good) to 5 (bad). Graded examinations are passed with grades 4 or lower.| Summer Term | Winter Term |
|---|---|
 |
|
 |
 |
 |
 |
 |
 |
 |
no examinations |
 |
 |
 |
 |
 |
 |
 |
 |
 |
 |
 |
 |
2.4 Examination Pass Rates - Electrical Engineering (2015 - today)
| Semester | Participants | Passed | Percentage |
|---|---|---|---|
| SS2025[1,3] | 45 | 14 | 31% |
| WS2024[1,3] | 44 | 12 | 27% |
| SS2024[1,3] | 24 | 7 | 29% |
| WS2023[1,3] | 42 | 29 | 69% |
| SS2023[1] | 16 | 4 | 25% |
| WS2022[1] | 67 | 34 | 51% |
| SS2022[1] | 13 | 7 | 54% |
| SS2021[1] | 4 | 3 | 75% |
| WS2020[1,2] | 17 | 4 | 24% |
| SS2020[1,2] | 16 | 10 | 63% |
| WS2019 | 6 | 6 | 100% |
| SS2019 | 27 | 9 | 33% |
| WS2018 | 47 | 30 | 63% |
| SS2018 | 22 | 19 | 86% |
| SS2017 | 33 | 33 | 100% |
| SS2016 | 5 | 5 | 100% |
| SS2015 | 28 | 20 | 71% |
| Total | 455 | 237 | 52% |
[2] free trial of examination due to Corona pandemic (uncounted if failed as per decision of the university steering committee)
[3] Inverted Classroom Teaching Method
2.5 Grades Overview - Electrical Engineering (2015 - today)
The elementary course in Electrical Engineering (Elektrotechnik 1) is an ungraded course at the Faculty of Electrical Engineering and Information Technology. Examination scores are 'passed' or 'not passed' so that no grades overviews exist.  Environmental Care - Print Savings due to Online-Examinations - 8500 Sheets.
Calculation: 10 sheets per examination (double-sided color prints for German and English versions) in average times registered attendees plus 10 prints for unregistered attendees. Unregistered attendees are allowed to attend the examination as per instruction of the examining board of the faculty. It will be decided later by the examination offices of the faculty, if the attendance was permitted.
Note: Students are registered for examinations by the University automatically and without self-action. The low attendance rates at examinations are the reason for lots of wasted prints. The University sticks to this practice despite several indications with the reasoning that students forget regularly to enroll for examinations. I therefore decided after the Corona pandemic to offer Online-Courses and Online-Examinations to eliminate this waste.
The waste savings due to prints for registered but non-attending students was 3690 sheets of paper (i.e. 43,4%). This amount would have been printed and dumped. Students normally (some rare exceptions do exist) do not collect these prints for training purpose as far as I can confirm.